Tag Archives: google analytics

Google Analytics Tips – Setting up Annotations

Being a rather forgetful person myself I always find it’s useful to make notes, lists and illegible scribbles of reminders, (if I had my way the whole office stationery budget would be spent on post-its!).

Thankfully other Analytics users are just as forgetful as me, thus 3 years ago Google felt the must support their less brainally retentive user base with a great feature Annotations.

These are basically just little comments you can add to dates on your reports. Great for marking what may have caused peaks or drops in traffic, page views, goals, etc. where the cause isn’t instantly apparent, for example Email Campaigns, Temporary adwords Campaigns, any offline advertising or maybe your site was down for half a day!

Here’s how you add annotations to your Google Analytics reports.

Assumed Knowledge:

  • Your Google Analytics Login (if you don’t have this don’t even bother reading on).
  • Basic Google Analytics Knowledge.
  • Minimal Amount of Computer Literacy.

How to add Analytics Annotations

  1. Open the report you want to annotate in Google Analytics.
  2. Double Click on the date you want to add an annotation to.
  3. Put your annotation text in the text box that appears (max 160 characters).
  4. Click the save button, simples!

Congratulations you’ve made your first ever annotation! You’ll notice that a small speech bubble icon appears under the date on the report timeline.

Google Analytics Report Annotations

You can also add annotations by clicking the small down arrow that appears under a report then click the “+ Create new annotation” link.

Other settings you can fiddle with are whether the annotation is private (only visible to your account) or shared (visible to all users who can access that report).

But what do annotations look like in reports? I hear you ask. Short answer, not much. In PDFs the speech bubble icon appears under the date on the timeline but you can’t see the annotation text :(

Facebook, Twitter and +1 Tracking on Webmaster Tools & Google Analytics

Google announced on their Webmaster Tools Blog that they are now tracking social media interactions with your site.

Webmaster Tools Plus1 TrackingIn Webmaster Tools you may have noticed a new menu section appear in the side bar.

Search Impact Report shows you how the click through rate of your organic traffic has been affected by +1′s (Click the image for Search Impact Report Screenshot).

Activity Report shows you how many times your pages have been +1′d both on your site and in the SERP.

Audience Report show how many individual users have +1′d your site, as wells as some demographic and geographic information (this information only shows up after a significant number of users have +1′d your site).

Check out our post on adding the Plus1 button to your site if you don’t already have it.

Google Analytics Social TrackingIf you use the new version of Google Analytics you will have seen a new Social menu item is now available with three reports:

Social Engagement Report shows you metrics of visits when users had some sort of interaction with your site. (Click the images for a screenshot of the Social Engagement Report).

Social Actions Report displays the number of each of the social interactions you are tracking on your site.

Social Pages lets you compare social interactions that occur on pages on your site to see which pages have the most interactions.


This tracking allows you to track social interactions from Facebook, Twitter, +1, Del.icio.us, LinkedIn and probably many more.

Analytics now Tracking Site Speed

On Wenesday Google announces on their Analytics Blog that you can now view a report of your sites’ speed.

This could become one of the most useful reports for optimisation especially since Google announced they are now considering site speed a ranking factor. However the results received must be taken with a pinch of salt, as only a small sample of page views are used to create an average which is displayed in the report.

As long as outliers or any type of extreme page views (eg. dial up internet) aren’t chosen for the report the results will be extremely informative and useful.

The report is only available in the new version of analytics, probably to create more incentive for users to convert.

To use this new feature you need to add the bold text into the currently existing Google Analytics tracking code;

For Asynchronous Code (This is usually the default) :

<script type="text/javascript">
 var _gaq = _gaq || [];
 _gaq.push(['_setAccount', 'UA-XXXXX-X']);
 _gaq.push(['_trackPageview']);
 _gaq.push(['_trackPageLoadTime']);

 (function() {
   var ga = document.createElement('script'); ga.type = 'text/javascript'; ga.async = true;
   ga.src = ('https:' == document.location.protocol ? 'https://ssl' : 'http://www') +
'.google-analytics.com/ga.js';
var s = document.getElementsByTagName('script')[0]; s.parentNode.insertBefore(ga, s);
})();
</script>

For Traditional Snippet:

<script type="text/javascript">
var gaJsHost = (("https:" == document.location.protocol) ? "https://ssl." : "http://www.");
document.write(unescape("%3Cscript src='" + gaJsHost + "google-analytics.com/ga.js'
type='text/javascript'%3E%3C/script%3E"));
</script>

<script type="text/javascript">
try{
var pageTracker = _gat._getTracker("UA-xxxxxx-x");
pageTracker._trackPageview();
pageTracker._trackPageLoadTime();
} catch(err) {}
</script>

If installed correctly site speed data should start showing up a few hours after the new code is uploaded.

More information about Installing the Site Speed Report.

My Experience of the New Google Analytics Interface

Three weeks ago Google announced on the Analytics blog that a new interface was available to use for some accounts, I’m not sure if it’s been rolled out across all accounts or if I was one of the lucky few who are able to use the new one, either way here is what you can expect from the new interface!

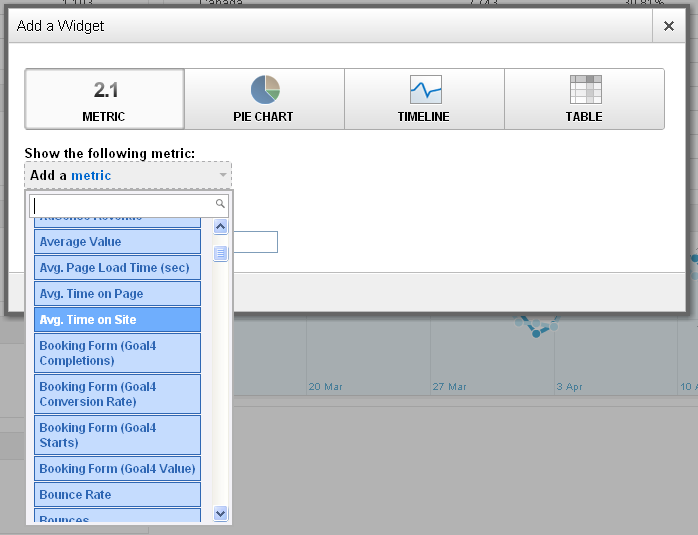
One of the main features to get excited about is a brand new dashboard which you can customise with as many widgets as you want displaying almost any metric, pie chart, timeline or table.

But it doesn’t allow you to add custom reports to the dashboard, which is a step backwards for an ‘upgrade’ however the new interface is still in BETA so Google Engineers may still add this feature.

Another feature I found useful that has disappeared is the ability to export as a PDF. The only options available now are CSV, TSV and CSV for Excel.

The content section has been changed, so instead of looking at a Top Content report you can see a pages report, which has a navigation summary tab above the time line graph which shows where users navigated from to get to that page and where users navigated to when they left that page (think of it like a non-graphical in page analytics).

This enables you to track the most popular routes users take to get to goals on your site.

Overall I’m impressed by the new interface hopefully some of the currently exclude features will be added when a full release is ready.